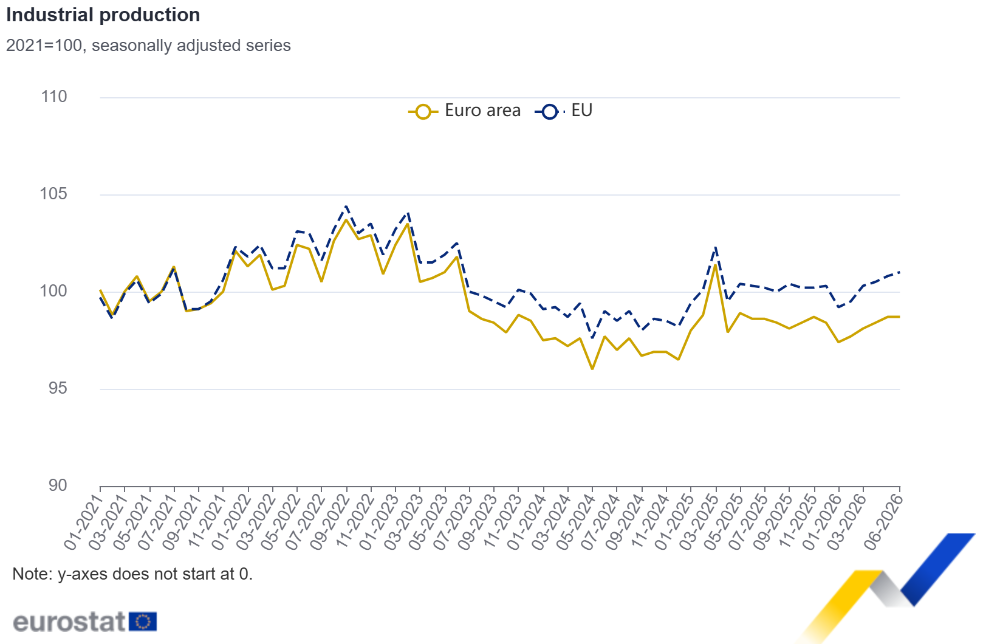
Eurostat has reported unchanged industrial production across the euro area in June, as weaker capital and intermediate goods were offset by gains in energy and consumer products.
Seasonally adjusted industrial output was flat compared with May across the euro area and increased by 0.2% across the European Union. Compared with June 2025, production was 0.1% higher in the euro area and 0.6% higher across the EU.
The aggregate result conceals a clear divide between industrial groupings. Euro-area capital-goods production fell by 1.4% month on month, while intermediate goods declined by 0.8%. Energy increased by 1.5%, durable consumer goods by 0.3%, and non-durable consumer goods by 3.0%.
The EU followed a similar pattern. Capital goods fell by 0.9% and intermediate goods by 0.7%, while energy output increased by 1.0%. Durable consumer goods rose by 0.9% and non-durable consumer goods by 2.5%.
Capital-goods output is closely tied to machinery, equipment, and other productive assets, making the June decline one of the more relevant elements for the industrial investment cycle. The monthly fall follows a 0.5% increase in May and leaves the series continuing to move unevenly rather than developing a consistent upward trend.
Intermediate goods provide another view of conditions further back in manufacturing supply chains. These include materials, components, chemicals, and other inputs that undergo further processing before becoming finished products, so changes can appear before weakness or growth becomes visible in final consumer output.
June’s figures are complicated by a substantial revision to May. Eurostat had previously reported that industrial production fell by 0.2% in the euro area and 0.1% in the EU during that month. The latest release revises both figures to increases of 0.3%.
The annual May comparison also changed materially. The original estimate showed euro-area production 1.2% below May 2025 and EU output 0.3% lower. Revised data put the euro-area decline at only 0.1% and show EU production 0.6% higher than a year earlier.
That revision changes the immediate sequence from contraction followed by stagnation to growth followed by stagnation. It is also a reminder of the volatility in monthly industrial statistics, particularly while companies adjust production schedules, inventories, energy use, and orders in an uncertain demand environment.
National results varied widely. Denmark recorded the largest monthly increase among countries with available data at 5.4%, followed by Croatia at 5.2%. Lithuania and Finland both increased by 2.1%.
At the other end of the range, Luxembourg’s industrial production fell by 10.7%, Portugal declined by 3.9%, and Estonia by 2.2%. Germany increased output by 0.2%, France was unchanged, Italy fell by 1.0%, Spain by 0.7%, and Poland by 0.3%.
That spread limits the usefulness of treating the European aggregate as a uniform manufacturing condition. National industrial structures differ considerably in their exposure to automotive production, chemicals, machinery, pharmaceuticals, energy, and export markets, so a flat euro-area number can conceal significant movement underneath.
The year-on-year figures are somewhat firmer than the monthly comparison. Euro-area intermediate goods were 0.4% higher than in June 2025, energy increased by 0.9%, and capital goods edged up by 0.1%. Durable consumer goods fell by 2.5% and non-durable consumer goods by 0.5%.
Across the EU, capital-goods production remained 0.9% higher year on year despite June’s monthly fall, while intermediate goods increased by 1.0%. Lithuania recorded the largest annual increase at 7.7%, followed by Denmark at 6.1% and Poland at 4.9%.
Industrial production therefore entered the second half of the year without a decisive direction. Upward revisions make May stronger than first reported, while June’s consumer and energy gains prevented an outright decline, but the 1.4% fall in euro-area capital goods leaves machinery and investment-related production as the weaker part of the latest release.